




A retry storm simulation can reveal a costly mistake: counting more attempts as more useful work. We built a local model with 100 fictional clients, fixed service capacity and three retry schedules. It shows why load, admitted queue depth and completion time need separate measurements.
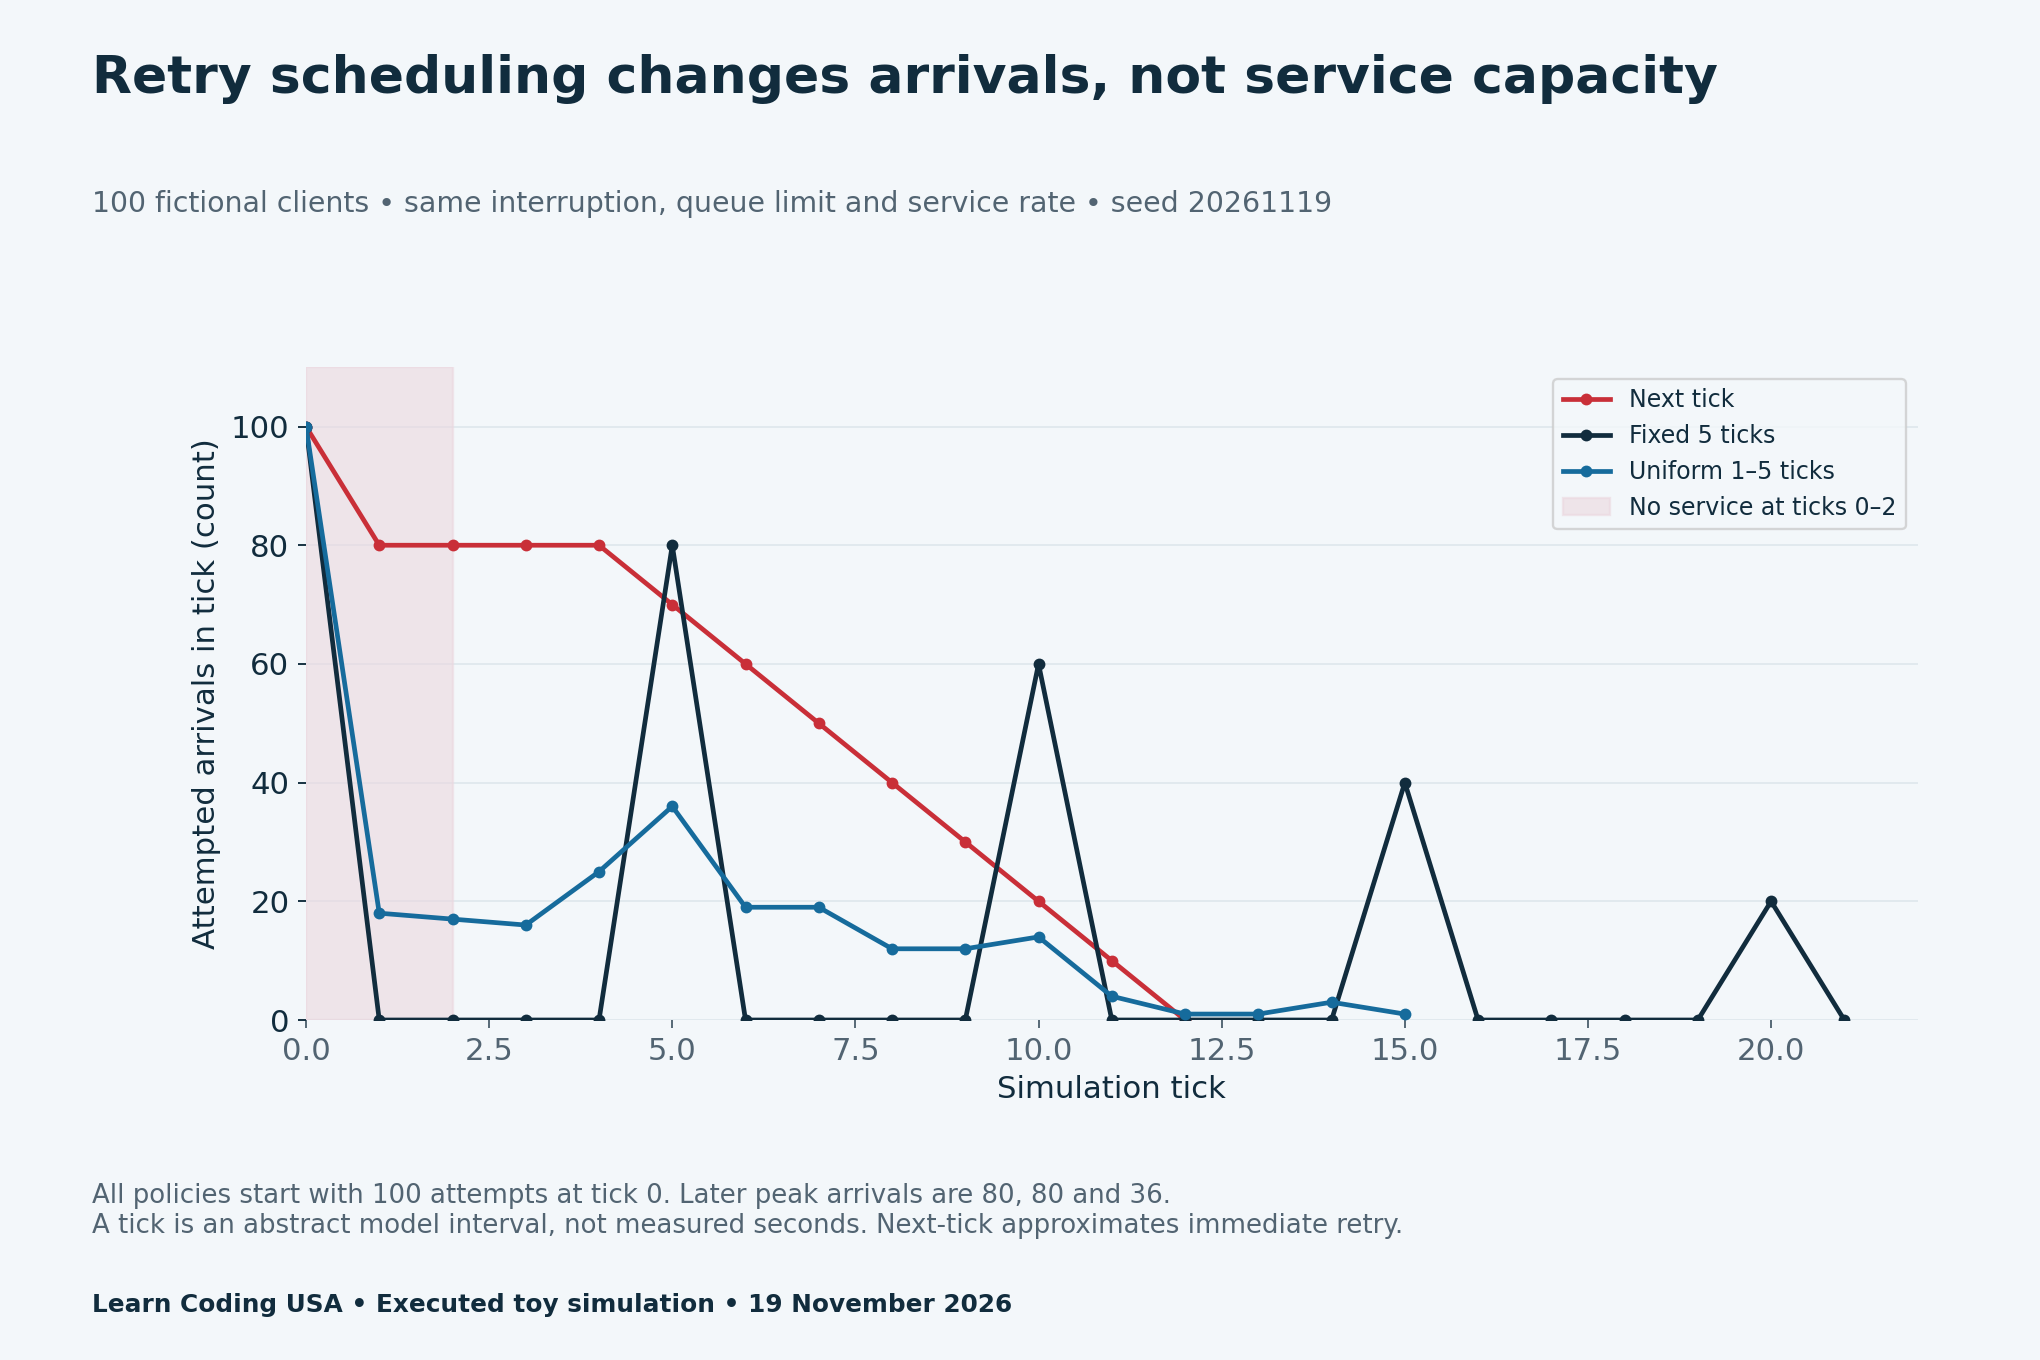
In this stated setup, next-tick retries made 700 attempts, fixed-delay retries made 300 and seeded random-delay retries made 298. All three completed the same 100 jobs. However, next-tick retries finished sooner than either delayed policy. The result is a tradeoff to inspect, not a claim that random delays always make recovery faster.
The news hook: reconnects can amplify an interruption
GitHub’s October availability report, published on 12 November 2026, describes failed requests triggering immediate new connections during its 21 October incident. More connections increased memory pressure and spread overload. GitHub says it added randomized reconnect delays. Our simulation explores scheduling only; it does not recreate that platform or estimate its incident savings.
The AWS Builders’ Library guide explains why retries can add load to a struggling service and why jitter can spread synchronized attempts. It also cautions about repeated side effects. Those principles motivate the exercise, while every number below comes from our own deliberately simplified model.
Define the retry storm simulation before reading the charts
Each of our 100 clients owns one fictional job and makes its first attempt at tick zero. The queue accepts at most 20 clients. Service is unavailable at ticks zero, one and two; from tick three onward, it completes at most ten queued jobs per tick. No policy changes that capacity.
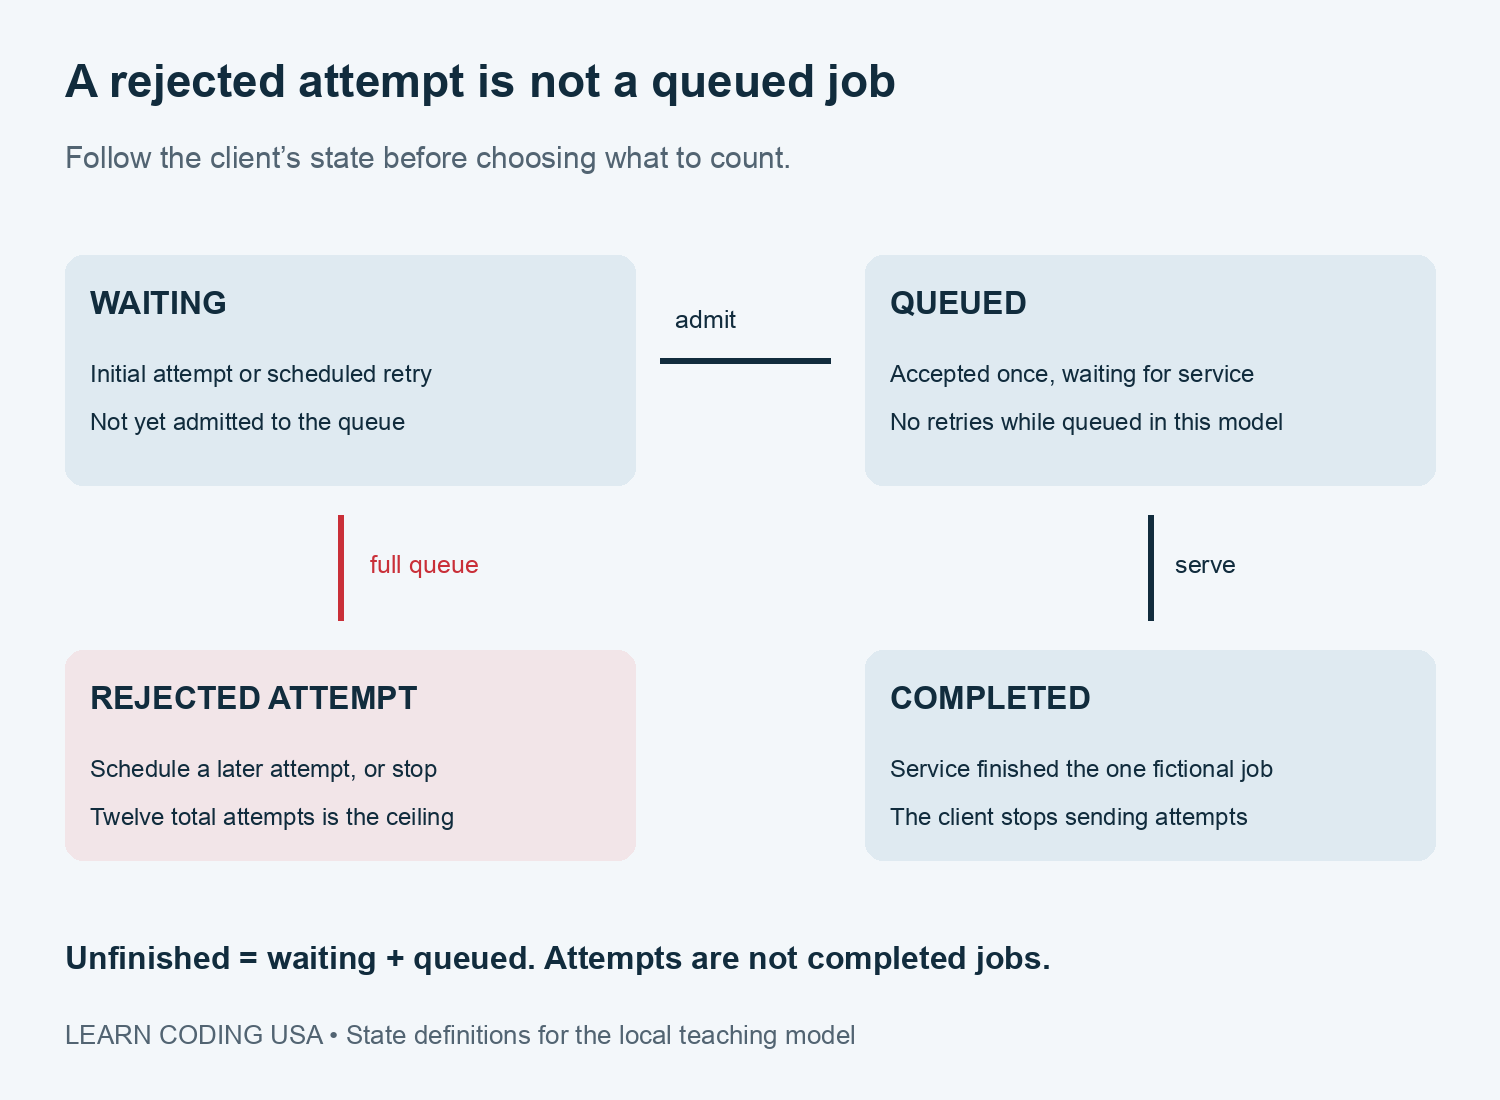
Within a tick, we process arrivals in client-ID order, admit clients while space remains, then run service. An admitted client stops retrying and waits in the queue. A rejected attempt either schedules another attempt or exhausts the client’s budget. This ordering is part of the model, not a universal server design.
| Input | Fixed choice | Interpretation |
|---|---|---|
| Clients | 100 | One fictional job each |
| Queue capacity | 20 | Maximum admitted waiting jobs |
| Healthy service | 10 per tick | Same for all policies |
| Interruption | Ticks 0–2 | No completions in those ticks |
| Attempt ceiling | 12 total | Includes the initial attempt |
| Random seed | 20261119 | One reproducible run, not an estimated distribution |
Compare three schedules under the same rules
The next-tick policy retries a rejected attempt one tick later. This approximates immediate retry at the model’s resolution; it avoids an impossible zero-time loop. The fixed policy waits five ticks. The random policy draws a uniform whole-number delay from one to five ticks after each rejection.
This random rule is not capped exponential backoff or a full production retry strategy. We fixed it so readers can inspect a small example without a complicated policy engine. All three policies use the same attempt ceiling, interruption, admission rule and service rate.
Count rejected attempts separately from successful work
The next-tick schedule recorded 600 rejected attempts alongside 100 admissions. The fixed schedule recorded 200 rejections, and the seeded random schedule recorded 198. An attempt is a request for admission; it is not a newly completed job. Our simulator does not assign a real CPU or network cost to that attempt.
| Policy | Attempts | Rejected | Completed | Last completion tick |
|---|---|---|---|---|
| Next tick | 700 | 600 | 100 | 12 |
| Fixed 5 ticks | 300 | 200 | 100 | 21 |
| Uniform 1–5 ticks | 298 | 198 | 100 | 15 |
The two-attempt difference between fixed and random delay is small and comes from one seeded model run. It is not a statistical estimate of a general advantage. Likewise, the 700-versus-298 comparison does not translate into a bill reduction or production throughput improvement without a model of those costs.
Inspect completion time as its own outcome
Next-tick retries completed the final job at tick 12. Random-delay retries completed at tick 15, while fixed-delay retries completed at tick 21. Thus, fewer attempts did not mean the fastest finish. A fixed pause can leave useful service slots idle while clients wait to try again.
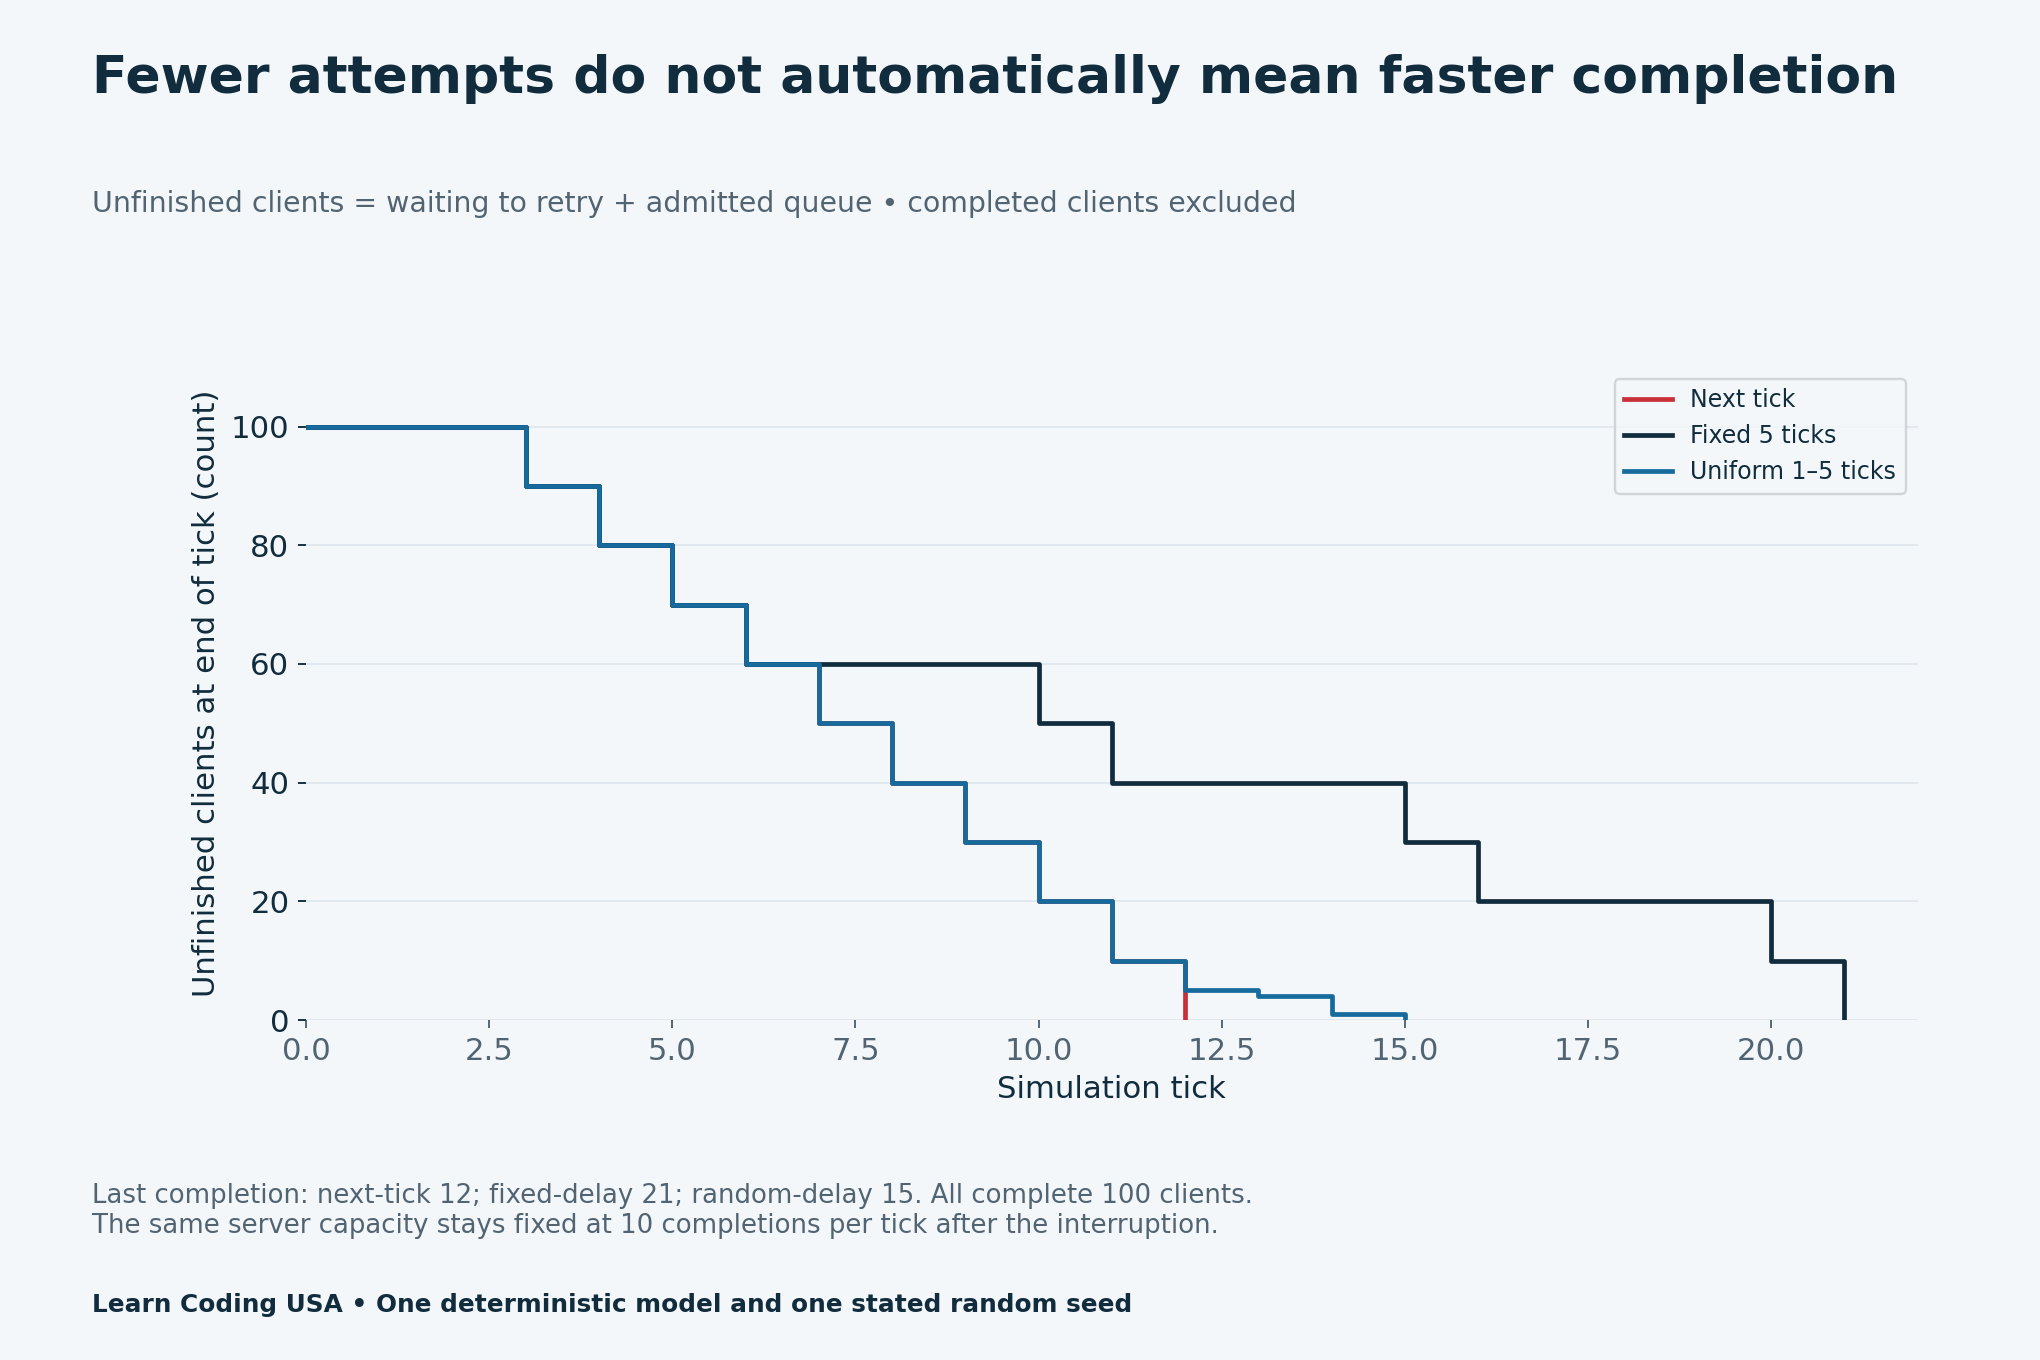
This model has no feedback from high attempt volume to service speed. Therefore, aggressive retries cannot slow the server through extra memory or connection work here. That omission helps explain why the quickest finish can still use the most attempts. It also prevents us from claiming to reproduce GitHub’s memory-pressure feedback loop.
Keep queue depth distinct from unfinished clients
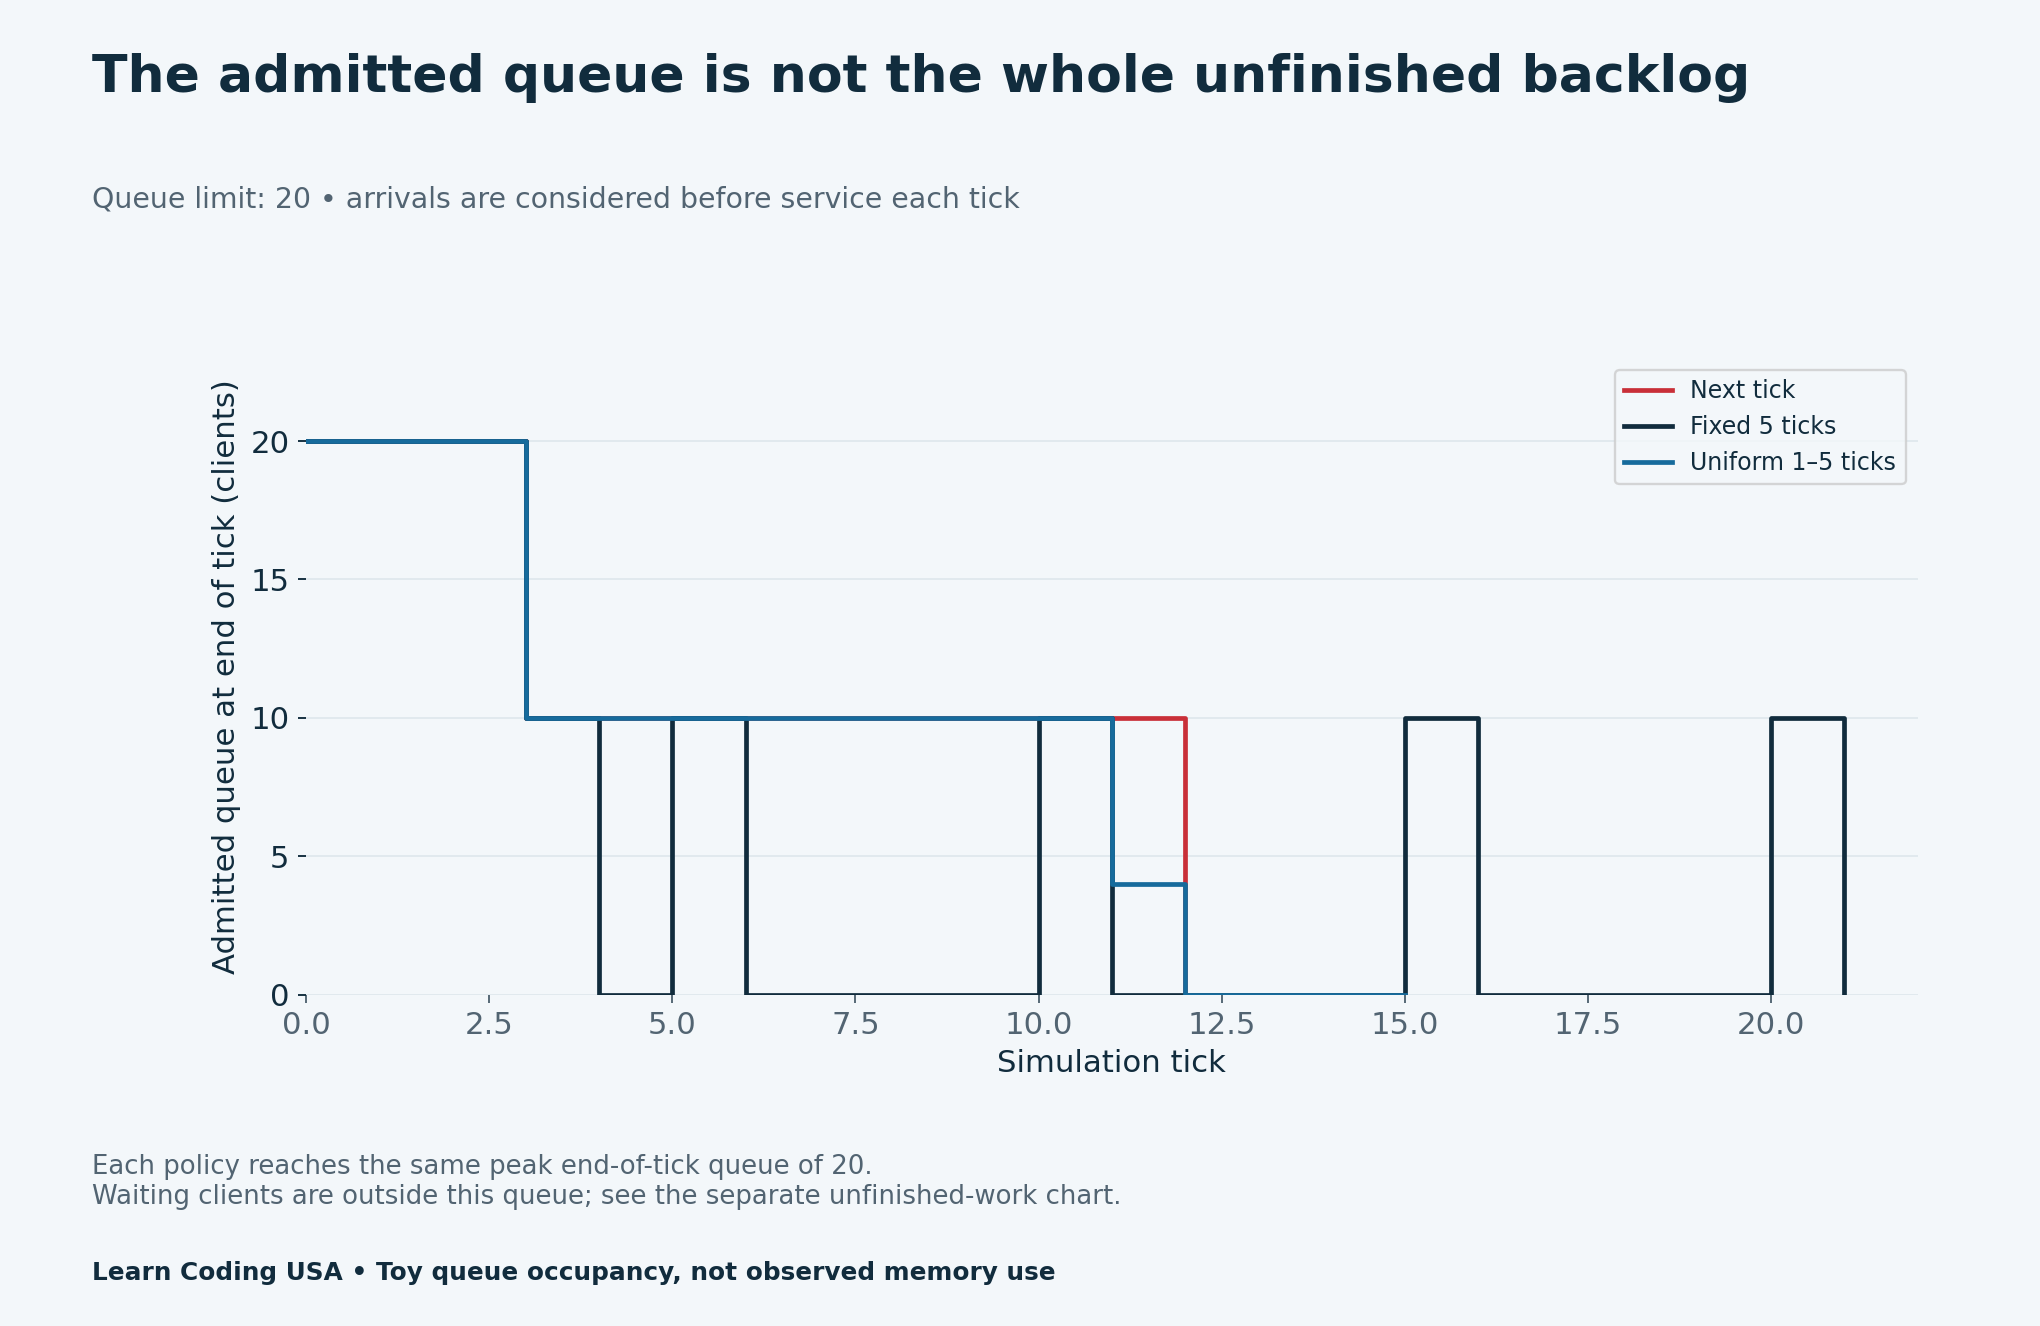
Every policy reaches a peak end-of-tick queue depth of 20. Random delay did not reduce that peak in this setup. The separate unfinished-work measure counts both queued clients and clients awaiting a retry. Use the field dictionary in the source code and CSV headers to avoid combining those populations.
Download and reproduce the retry storm simulation
- Every simulated tick and client-state count (CSV)
- Policy attempts, completions and peak summaries (CSV)
- All model inputs and interpretation limits (CSV)
- Blank retry-policy evidence worksheet (CSV)
- Local simulator, configuration, outputs and instructions (ZIP)
Read the Python runner before executing it. It uses only the standard library and makes no network requests. Internal checks enforce queue capacity and account for all 100 clients at every tick. You can change one input at a time, rerun it locally and compare outputs without sending traffic to a public endpoint.
What to carry into a real engineering review
First, establish whether repeating the operation is safe and which failures may be retried. Then inspect timeout meaning, retry ceilings, delay rules and capacity signals. A timeout does not prove that a remote side effect failed to occur. Our one-job admission model does not test duplicate payments, writes or other real effects.
Tech Consulting Tailored to Your Coding Journey
Get expert guidance in coding with a personalized consultation. Receive unique, actionable insights delivered in 1-3 business days.
Get StartedWe used one seed and a small fixed population. There is no live traffic, new-client arrival stream, network latency, process memory model or cascading service topology. More seeds and different assumptions can change the result. Use the worksheet to document those gaps instead of promoting the toy settings as production defaults.
For related measurement practice, see our Rust benchmark guide and Cargo diagnostic-coverage fixture. Define the event you count, keep the capacity assumption visible and report the tradeoff the experiment actually supports.


