






An AI browser testing benchmark should measure the work needed to accept a change, not just the speed of generating its first screen. Browser inspection can reveal useful evidence. It can also add setup, retries and findings that a person must review. Count that work before you claim a productivity gain.
This guide provides a paired-review ledger, five proposed fault recipes and transparent cost calculations. The examples are fictional teaching inputs. We have not run a human-versus-agent trial or measured a speedup for US developers. Use the files to design and record your own controlled project exercise.
Read the new case study without merging its metrics
Chrome’s 10 November 2026 case study reports 92% less manual auditing effort across roughly 30 Policybazaar landing pages. For Pensionbazaar, it reports more than 90% faster new-screen development/testing turnaround, from about four days to a few hours, and more than 90% fewer UI bugs raised. These are two related Indian businesses with different outcomes. The page does not establish a precise measurement period.
| Company | Reported outcome | Use in your benchmark |
|---|---|---|
| Policybazaar | 92% less manual audit effort | Define what counts as manual effort |
| Pensionbazaar | >90% faster screen turnaround | Separate elapsed time from active effort |
| Pensionbazaar | >90% fewer UI bugs raised | Track defects as well as time |
Do not average the three percentages, apply them to your salary or promise the same improvement for a portfolio project. Instead, take the measurement problem seriously: decide what the baseline includes, when a change is accepted and which defects matter. Those decisions determine whether your own comparison is meaningful.
Define the full change cycle before starting
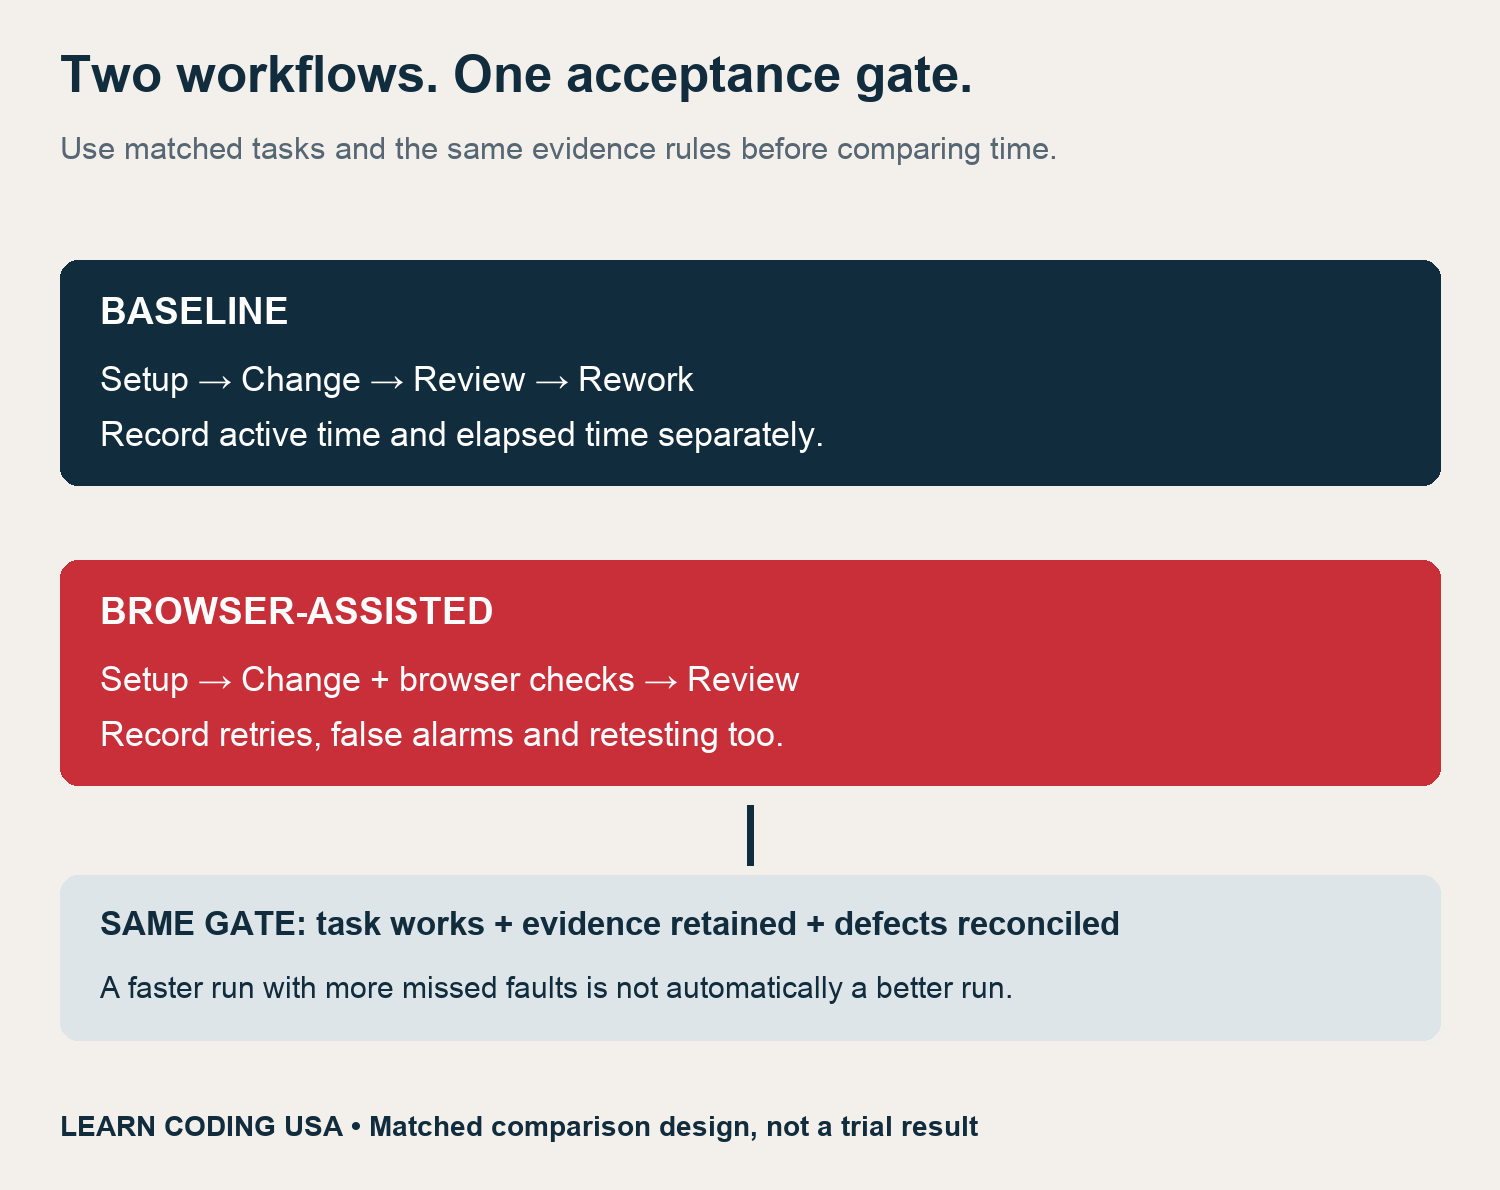
Use one start event for both workflows: an approved task with the same acceptance rules and a clean starting revision. Stop only when the reviewer accepts the change and the evidence is retained. A draft render is an intermediate event. A screenshot alone does not establish that a form works or that keyboard focus remains visible.
Log active effort in four non-overlapping buckets: setup, code change, review and rework with retesting. Keep elapsed turnaround in a separate column. A background wait may lengthen the delivery cycle without consuming the same number of active minutes. Decide beforehand how shared setup will be allocated across repeated tasks.
Build five safe, deliberately faulty local tasks
Create synthetic pages that you own. Give each a known fault and a written acceptance rule. Keep real customer data, production credentials and private designs out of the exercise. A local toy page is enough to test your review process; it does not need to resemble a live insurance application.
| Fault recipe | Evidence to retain |
|---|---|
| Overflow at a 390px viewport | Rendered document width and screenshots at the chosen sizes |
| Missing visible keyboard focus | Keyboard task trace and focused-control evidence |
| Input without a programmatic label | Accessible name and relevant label relationship |
| Deliberate console error after an action | Exact test message and triggering action |
| Delayed owned resource | Named request and predefined budget |
Chrome’s Console documentation explains the role of logged messages in debugging. Its Network guide shows how to inspect resource requests. Use those sources to define the evidence you need. An unrelated extension warning is not automatically the deliberate application fault you planted.
For accessibility, retain manual checks as a separate method. W3C’s Easy Checks guide covers initial keyboard, focus, form-label and other checks while warning that this first review is not comprehensive. Passing your small fixture cannot establish accessibility conformance for a complete product.
Counterbalance order and preserve a held-out variant
The second attempt can be faster because the reviewer remembers the page. Use matched variants with equivalent fault classes, then alternate which workflow runs first. Our blank ledger includes P01 with baseline first and P02 with browser assistance first. These are planning rows, not completed sessions.
Keep a ground-truth key separate from the reviewer’s working instructions. Otherwise the task becomes checking a supplied answer list. Record the reviewer’s prior familiarity and any assistance used. For a classroom exercise, use aliases and avoid collecting unrelated personal details.
Pin the model, browser, tool configuration, prompt, viewport and starting revision for each run. If one changes, record it. Preserve a clean fixture copy for each attempt. Let the assisted path inspect its rendered result, but give both paths the same final acceptance criteria and the same authority to request a retest.
Use the AI browser testing benchmark cost ledger
Our chosen baseline has 2 minutes of setup, 12 for the code change, 14 for review and 12 for rework: 40 active minutes. The fictional assisted path has 8, 4, 6 and 8 minutes respectively: 26. The total reduction is (40 − 26) ÷ 40 × 100 = 35%. It is arithmetic on selected inputs, not a measured result.
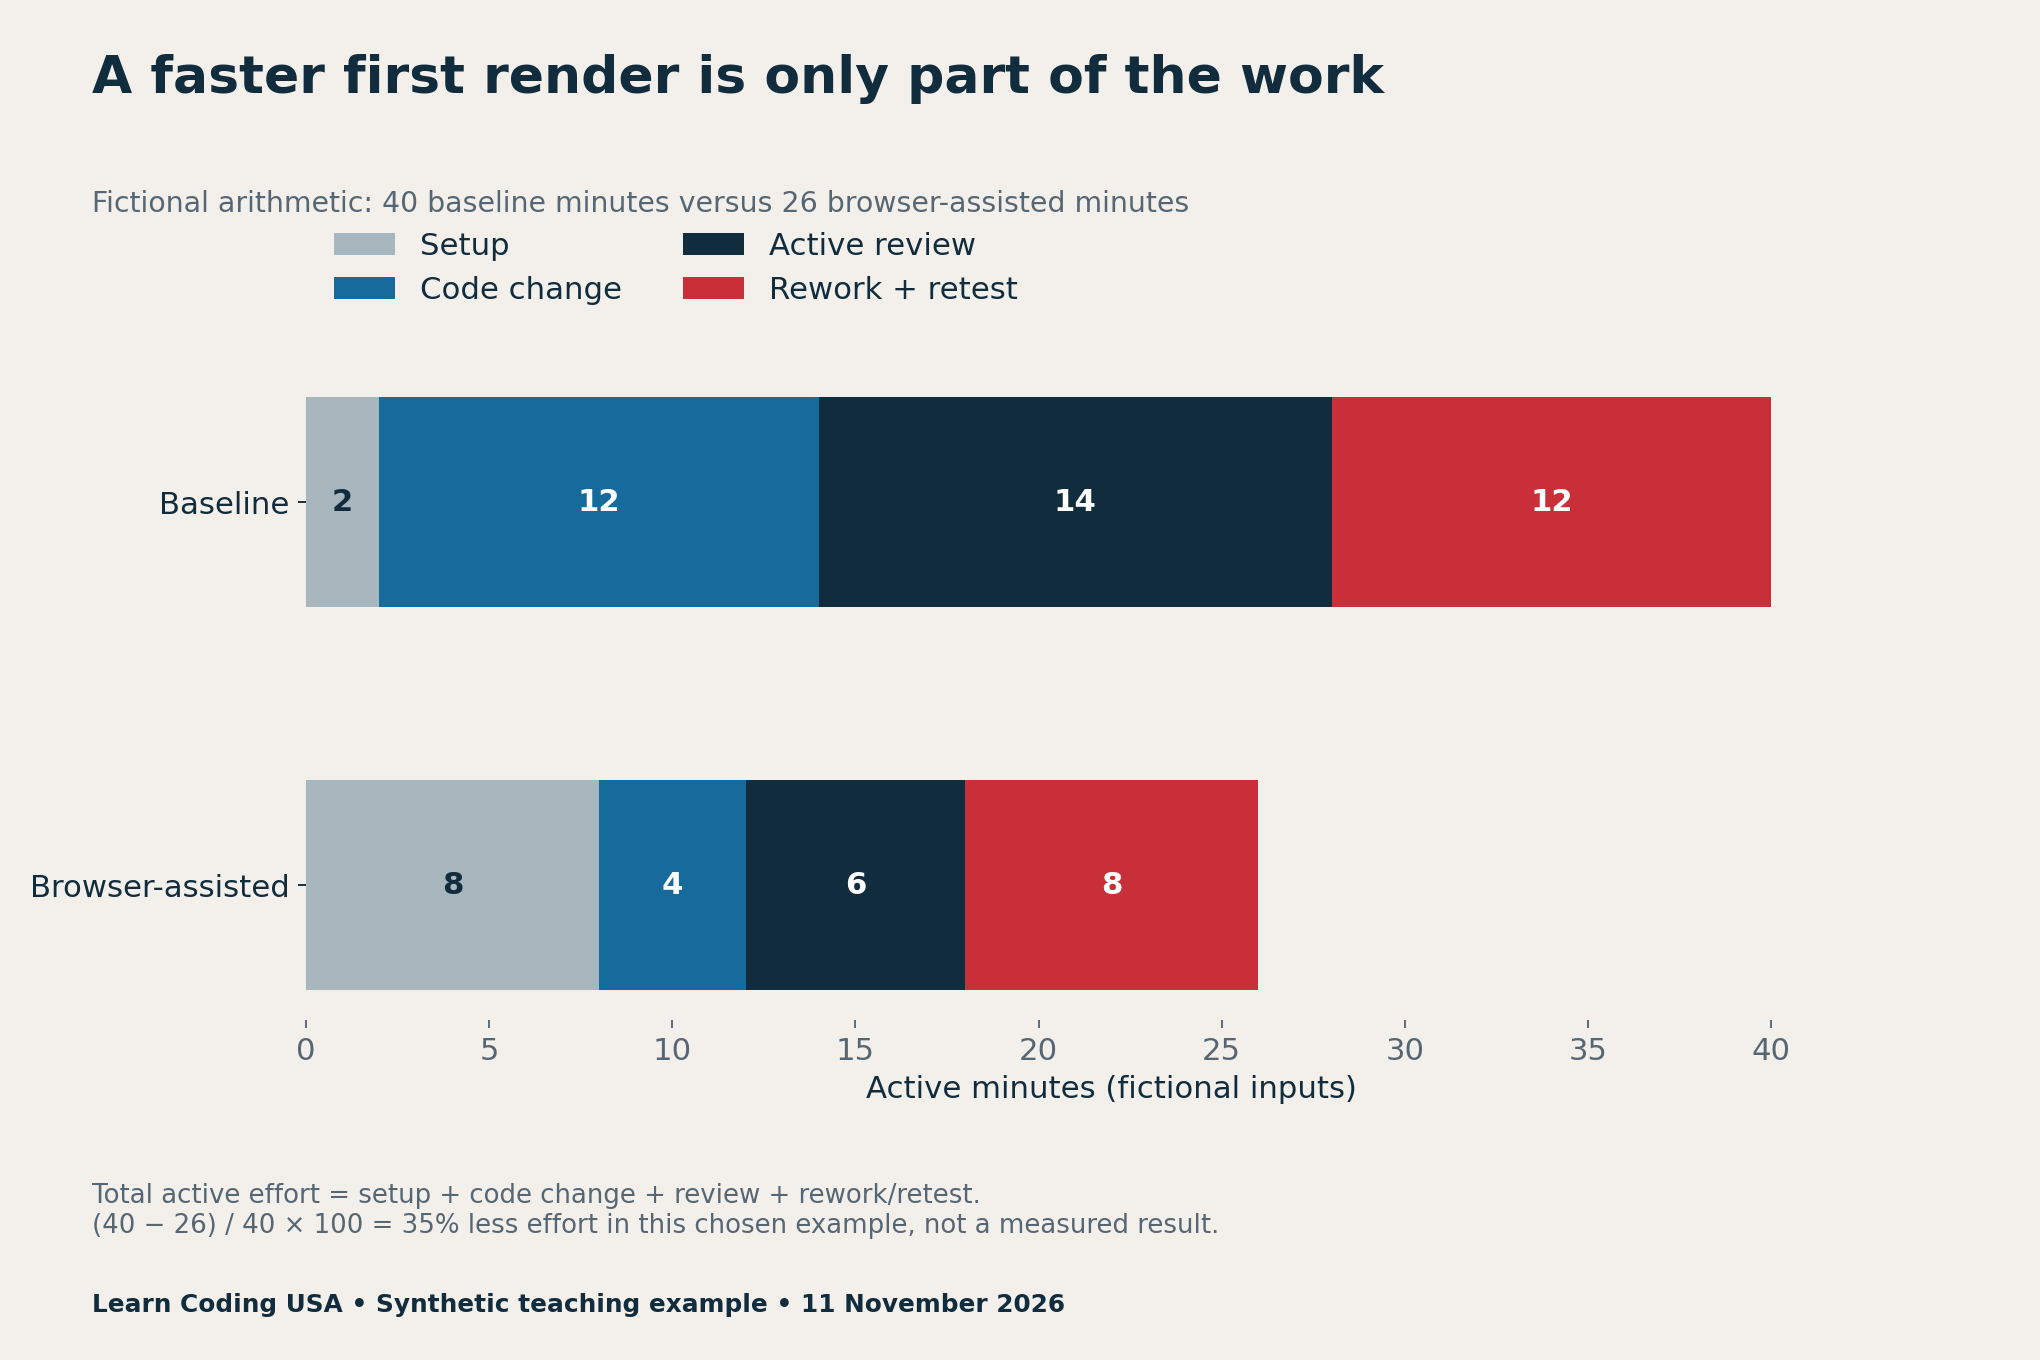
Apply the formula only when the baseline is greater than zero and the endpoints match. A negative result means the assisted path took more effort. Do not replace that result with zero. For several tasks, report paired differences and the underlying rows; a small convenient sample cannot establish a population-wide gain.
Account for false alarms and missed defects
A tool can consume review time on a finding that does not violate the acceptance rule. Log that as a false alarm after adjudication. A duplicate is not necessarily a false alarm: retain its relationship to the original issue. Count each seeded defect once when calculating detection coverage.
Tech Consulting Tailored to Your Coding Journey
Get expert guidance in coding with a personalized consultation. Receive unique, actionable insights delivered in 1-3 business days.
Get StartedFor a controlled fixture, missed defects equal seeded defects minus correctly detected unique seeded defects. If five faults are planted and only four are correctly identified, the missed count is one. That arithmetic example is not an executed result. In an ordinary production page, you rarely know the complete defect population, so the same denominator may not be available.
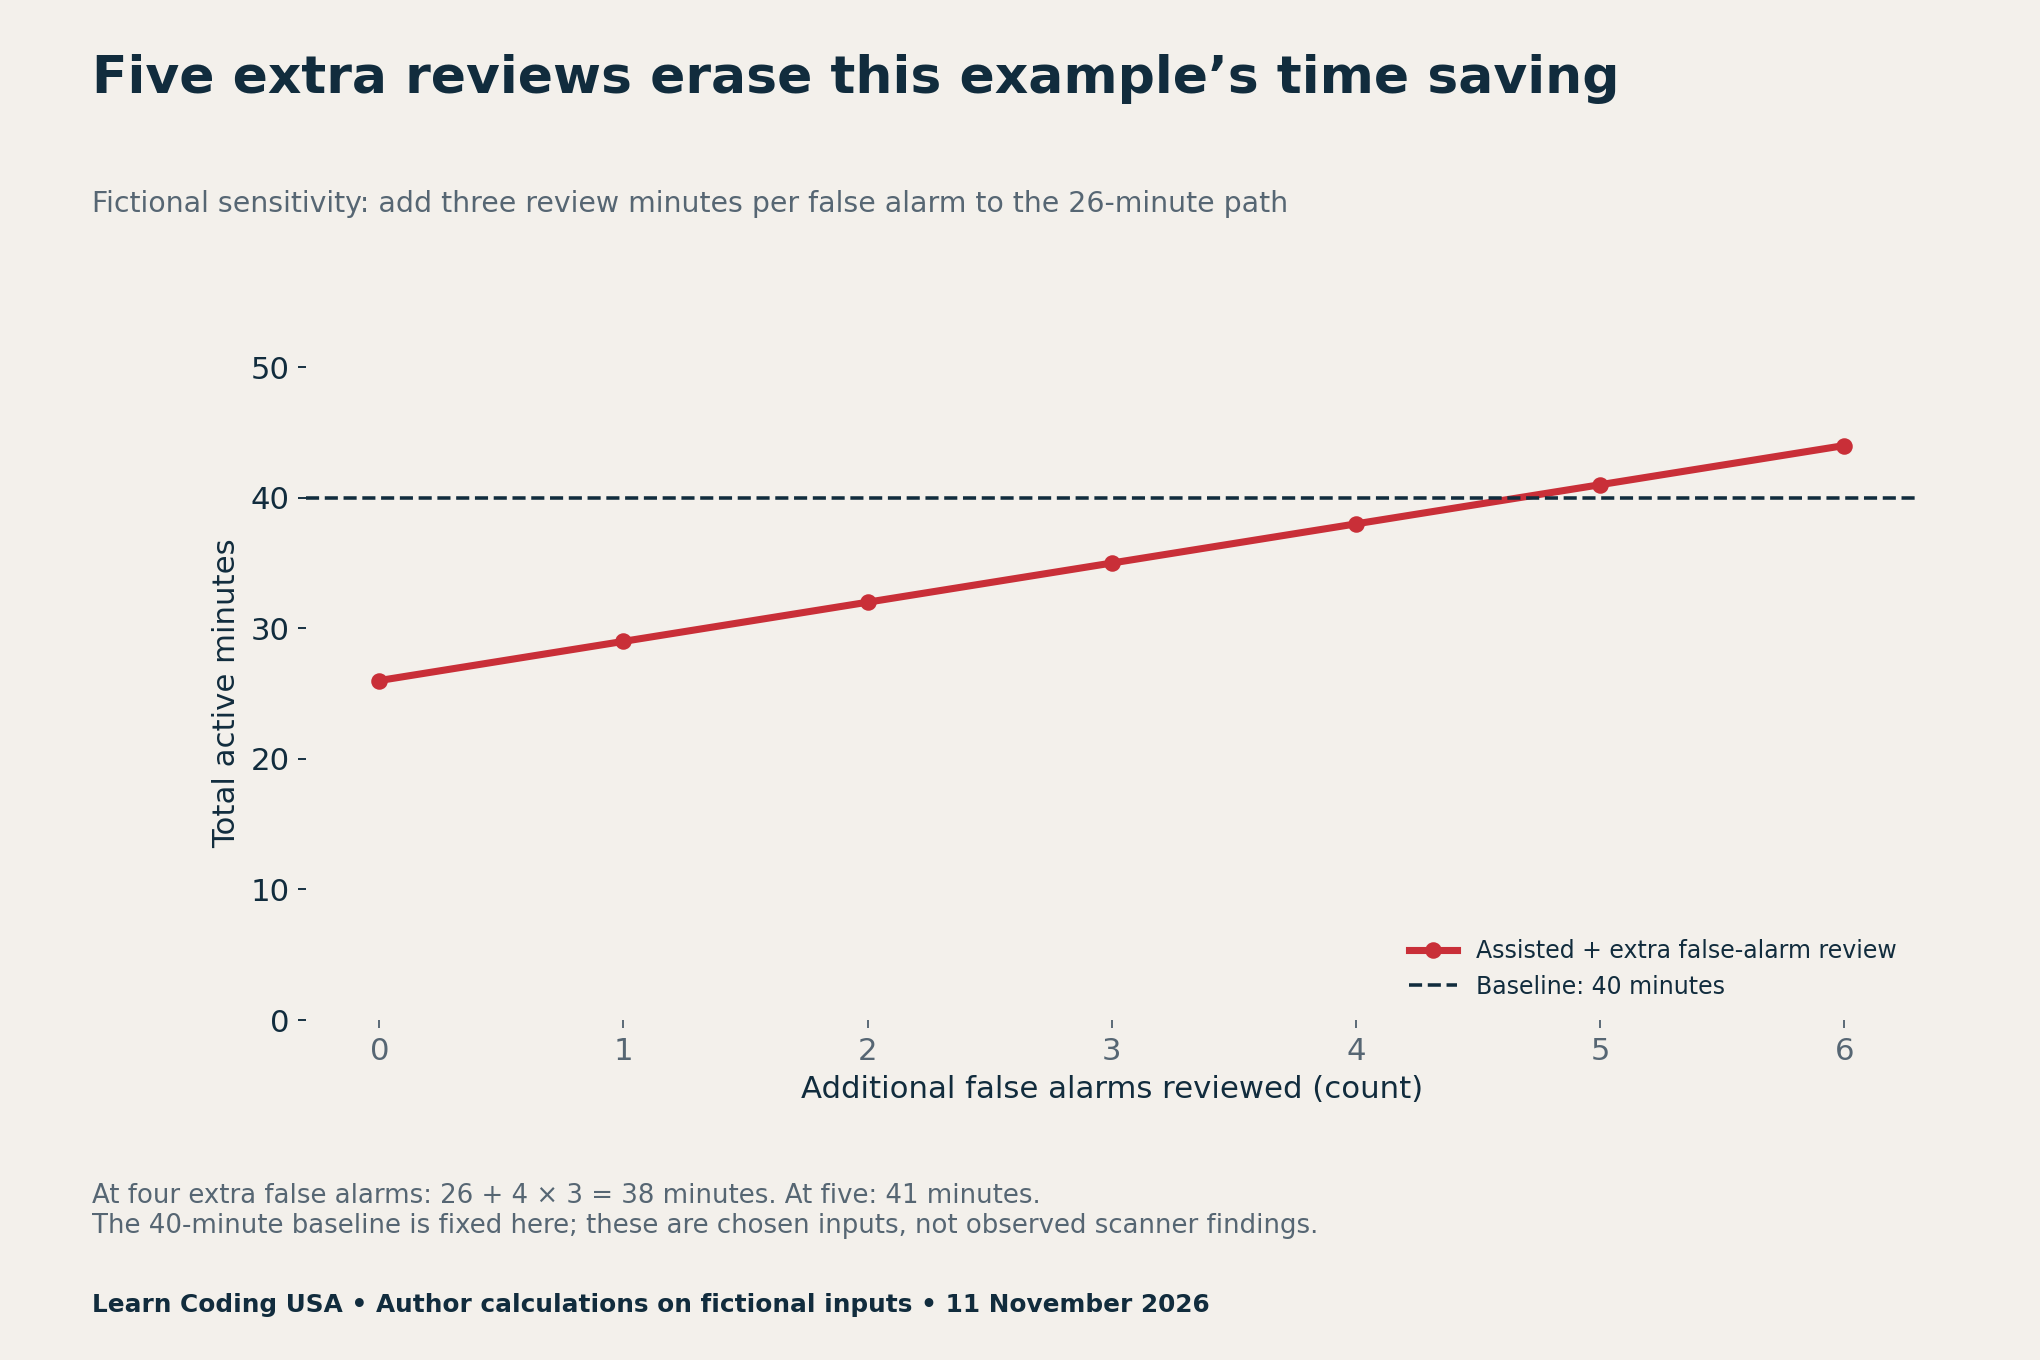
Time and detection are separate outcomes. Report them together instead of inventing a composite productivity score. A fast path that leaves a critical seeded fault unresolved should not become a success merely because its stopwatch stopped earlier. Keep rejected changes and unfinished runs visible in your results.
Download the benchmark planning files
- Separated source claims (CSV)
- Fictional full-cycle cost calculation (CSV)
- Blank counterbalanced review ledger (CSV)
- Five proposed fault recipes and evidence rules (CSV)
The source ledger keeps each company and outcome separate. The cost file contains the chosen values behind Figure 1. The blank ledger is for your own observations. The fault protocol deliberately retains not_run rather than treating an untested check as a pass.
For another example of retaining inputs and exclusions, see our reproducible AI data analysis project. For maintenance evidence across different tools, use the Git security update checklist. Those guides address different questions and are not evidence that a browser-testing workflow is faster.
Method, scope and citation
Research checked 11 November 2026. We separated the fresh vendor-published case from official debugging and accessibility guidance. We executed the totals and sensitivity calculations locally on wholly fictional inputs. No browser fault-detection trial, human timing study or independent replication of the company results was performed.
Suggested citation: Learn Coding USA, “AI Browser Testing Benchmark: Measure Full Review Time,” 11 November 2026. Credit Chrome for the reported case and this article for the original ledger and teaching calculations. Share evidence-backed corrections through our contact page.


