




Incident duration vs user downtime is a measurement question before it is a calculation. A long incident record can include a short disruption to broad requests and a longer pause affecting one activity. Putting all three into one “site down” field loses that distinction.
We use a newly published GitHub report as a source-reading example, then test an original interval-merging project on fictional data. All 11 designed fixtures matched their expected result or rejection. The project does not calculate GitHub’s monthly uptime.
Incident duration vs user downtime: read the scope first
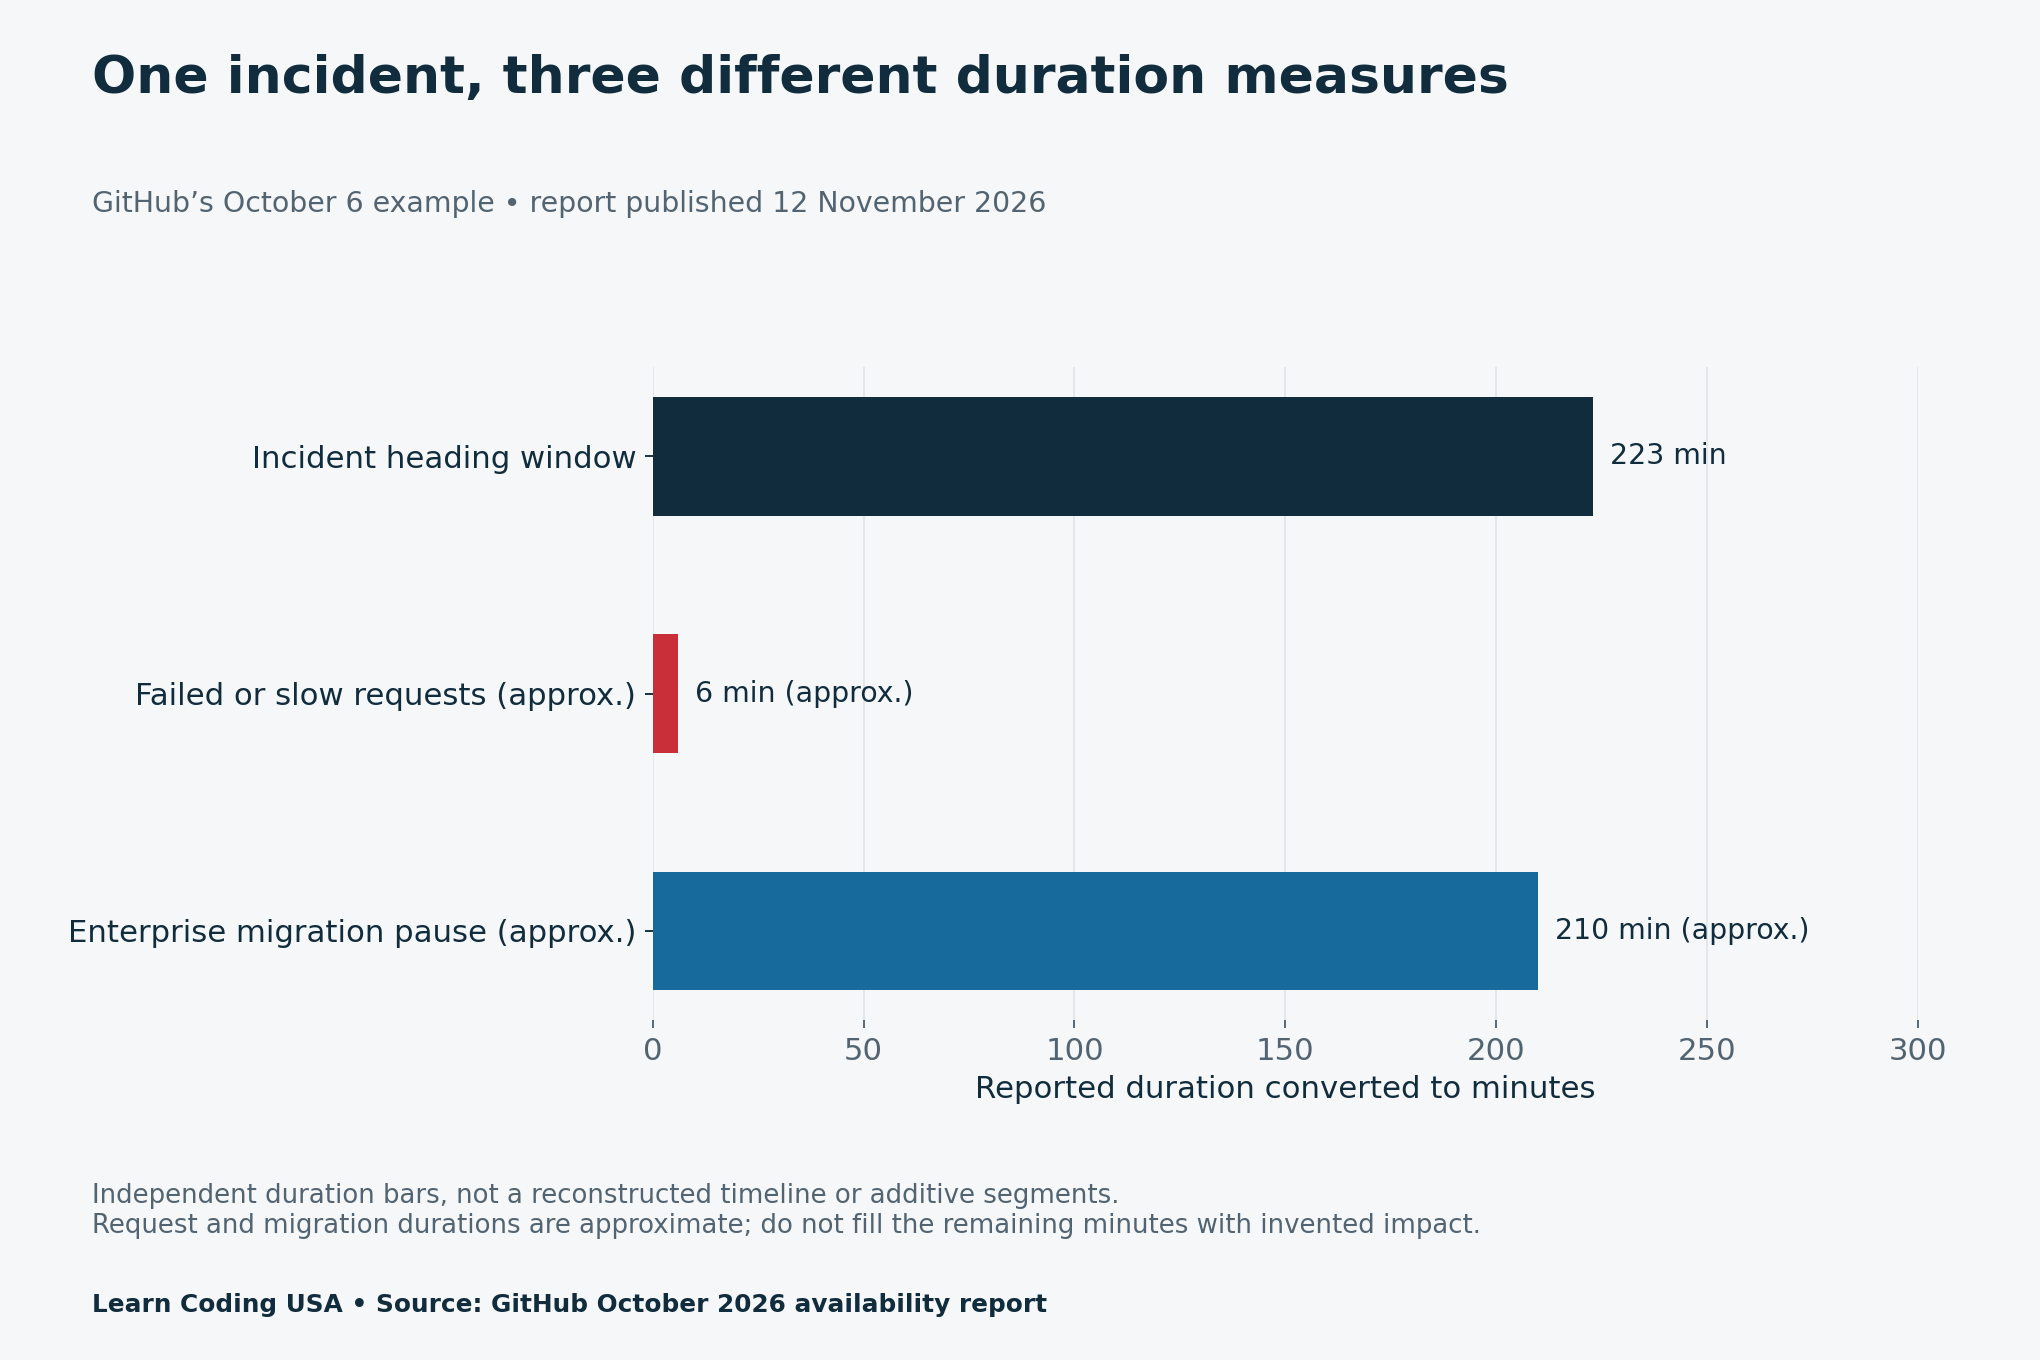
GitHub’s 12 November report on October 2026 availability records eight incidents. For October 6, its heading gives a three-hour, 43-minute window. The explanation distinguishes approximately six minutes of failed or slow requests from approximately three hours and 30 minutes of paused enterprise migrations.
The same account reports a peak request failure or timeout rate of about 1.3%, and about 6,400 organisations with at least one failed or slow request. Peak rate, organisation count and duration have different units and populations. None is a count of all individual users who lost access.
Keep unknown timing visible
Converting three hours and 43 minutes to 223 minutes is straightforward arithmetic. Assigning every one of those minutes to every user is a separate claim that the source does not support. Likewise, subtracting the two rounded symptom durations does not reveal a precisely timed missing phase.
For that reason, our source CSV records reported durations and qualification labels without inventing symptom start and end times. A duration-only record can still be useful. It simply cannot support the same interval calculation as an independently observed pair of endpoints.
Design fields around the question you can answer
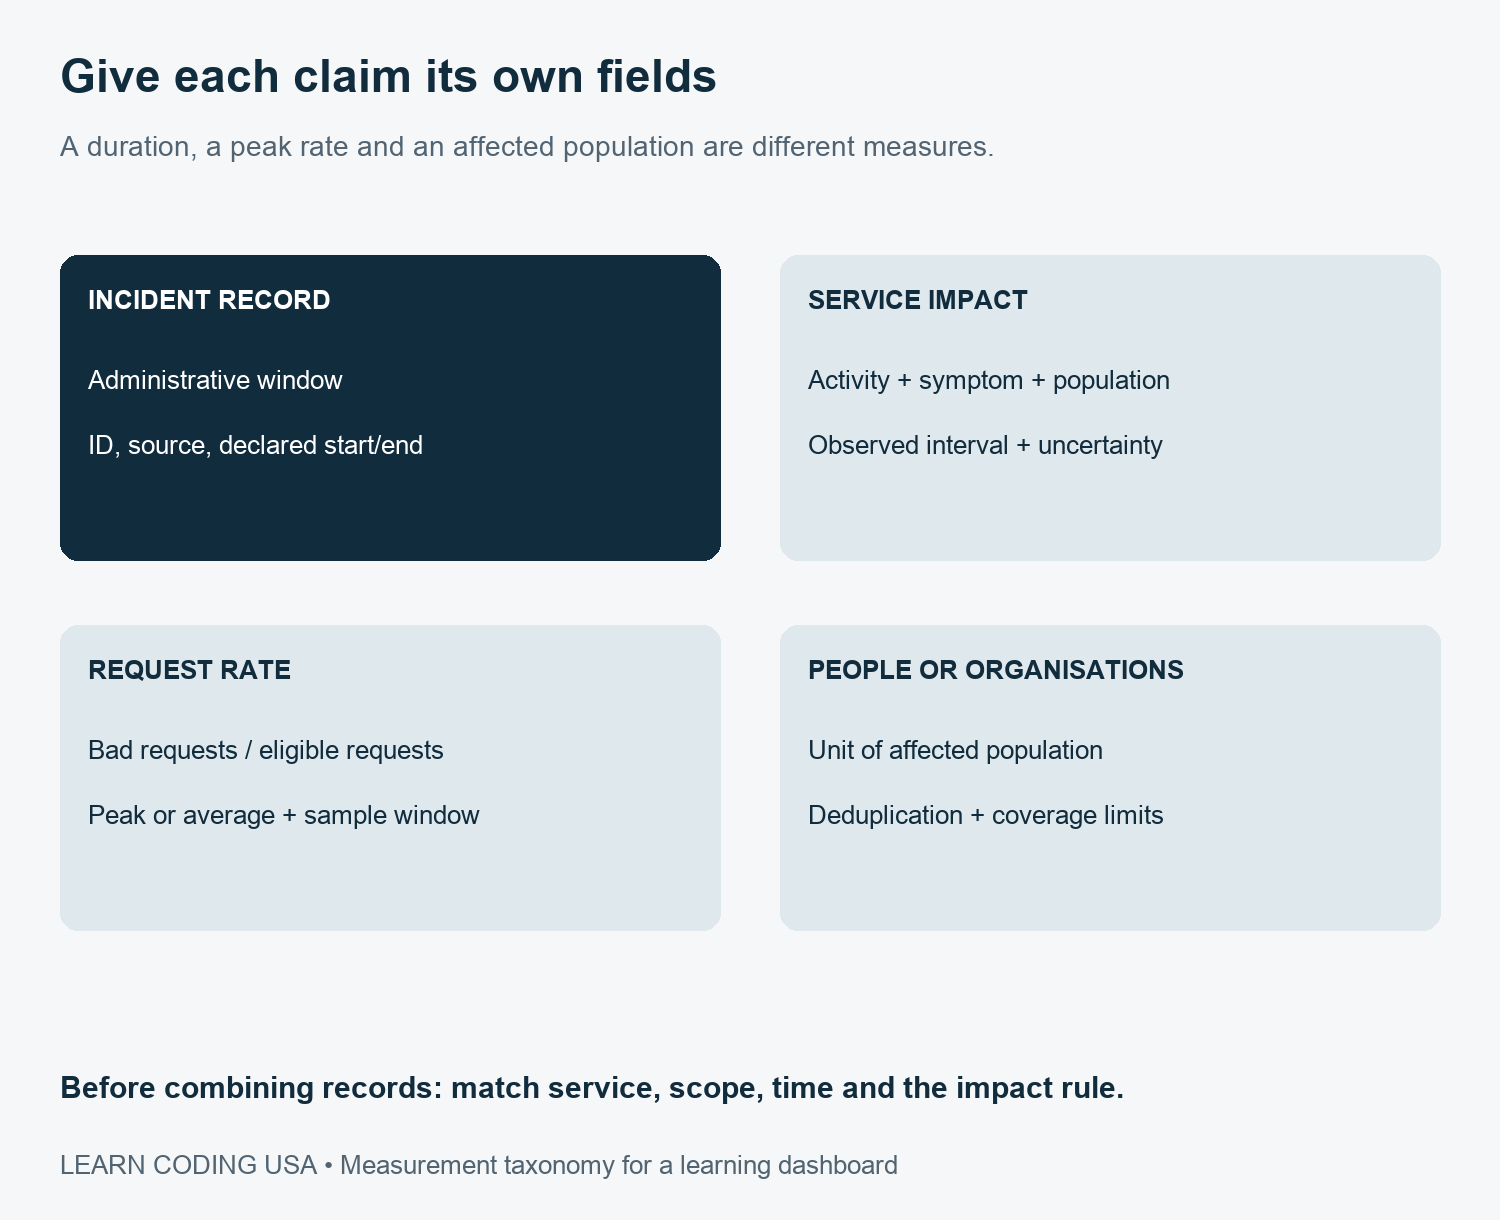
Our learning model separates the incident identifier from service impact. Each impact record names an activity, symptom and population. It also stores a source, timezone-aware endpoints when known, and a note explaining approximation or missing information.
A request-rate record needs its own numerator, denominator and observation window. An affected-organisation record needs its own unit and deduplication rule. Keeping these records separate makes it harder for a dashboard label to turn a peak percentage into an average or a company count into a people count.
The interval-union experiment
Next, we wrote a small Python function for a narrower task: calculate covered time from known intervals for one defined service and impact rule. It parses timezone-aware endpoints, normalises them to UTC, sorts the intervals and merges overlaps or adjacent intervals. It rejects missing endpoints, absent timezone information and reversed ranges.
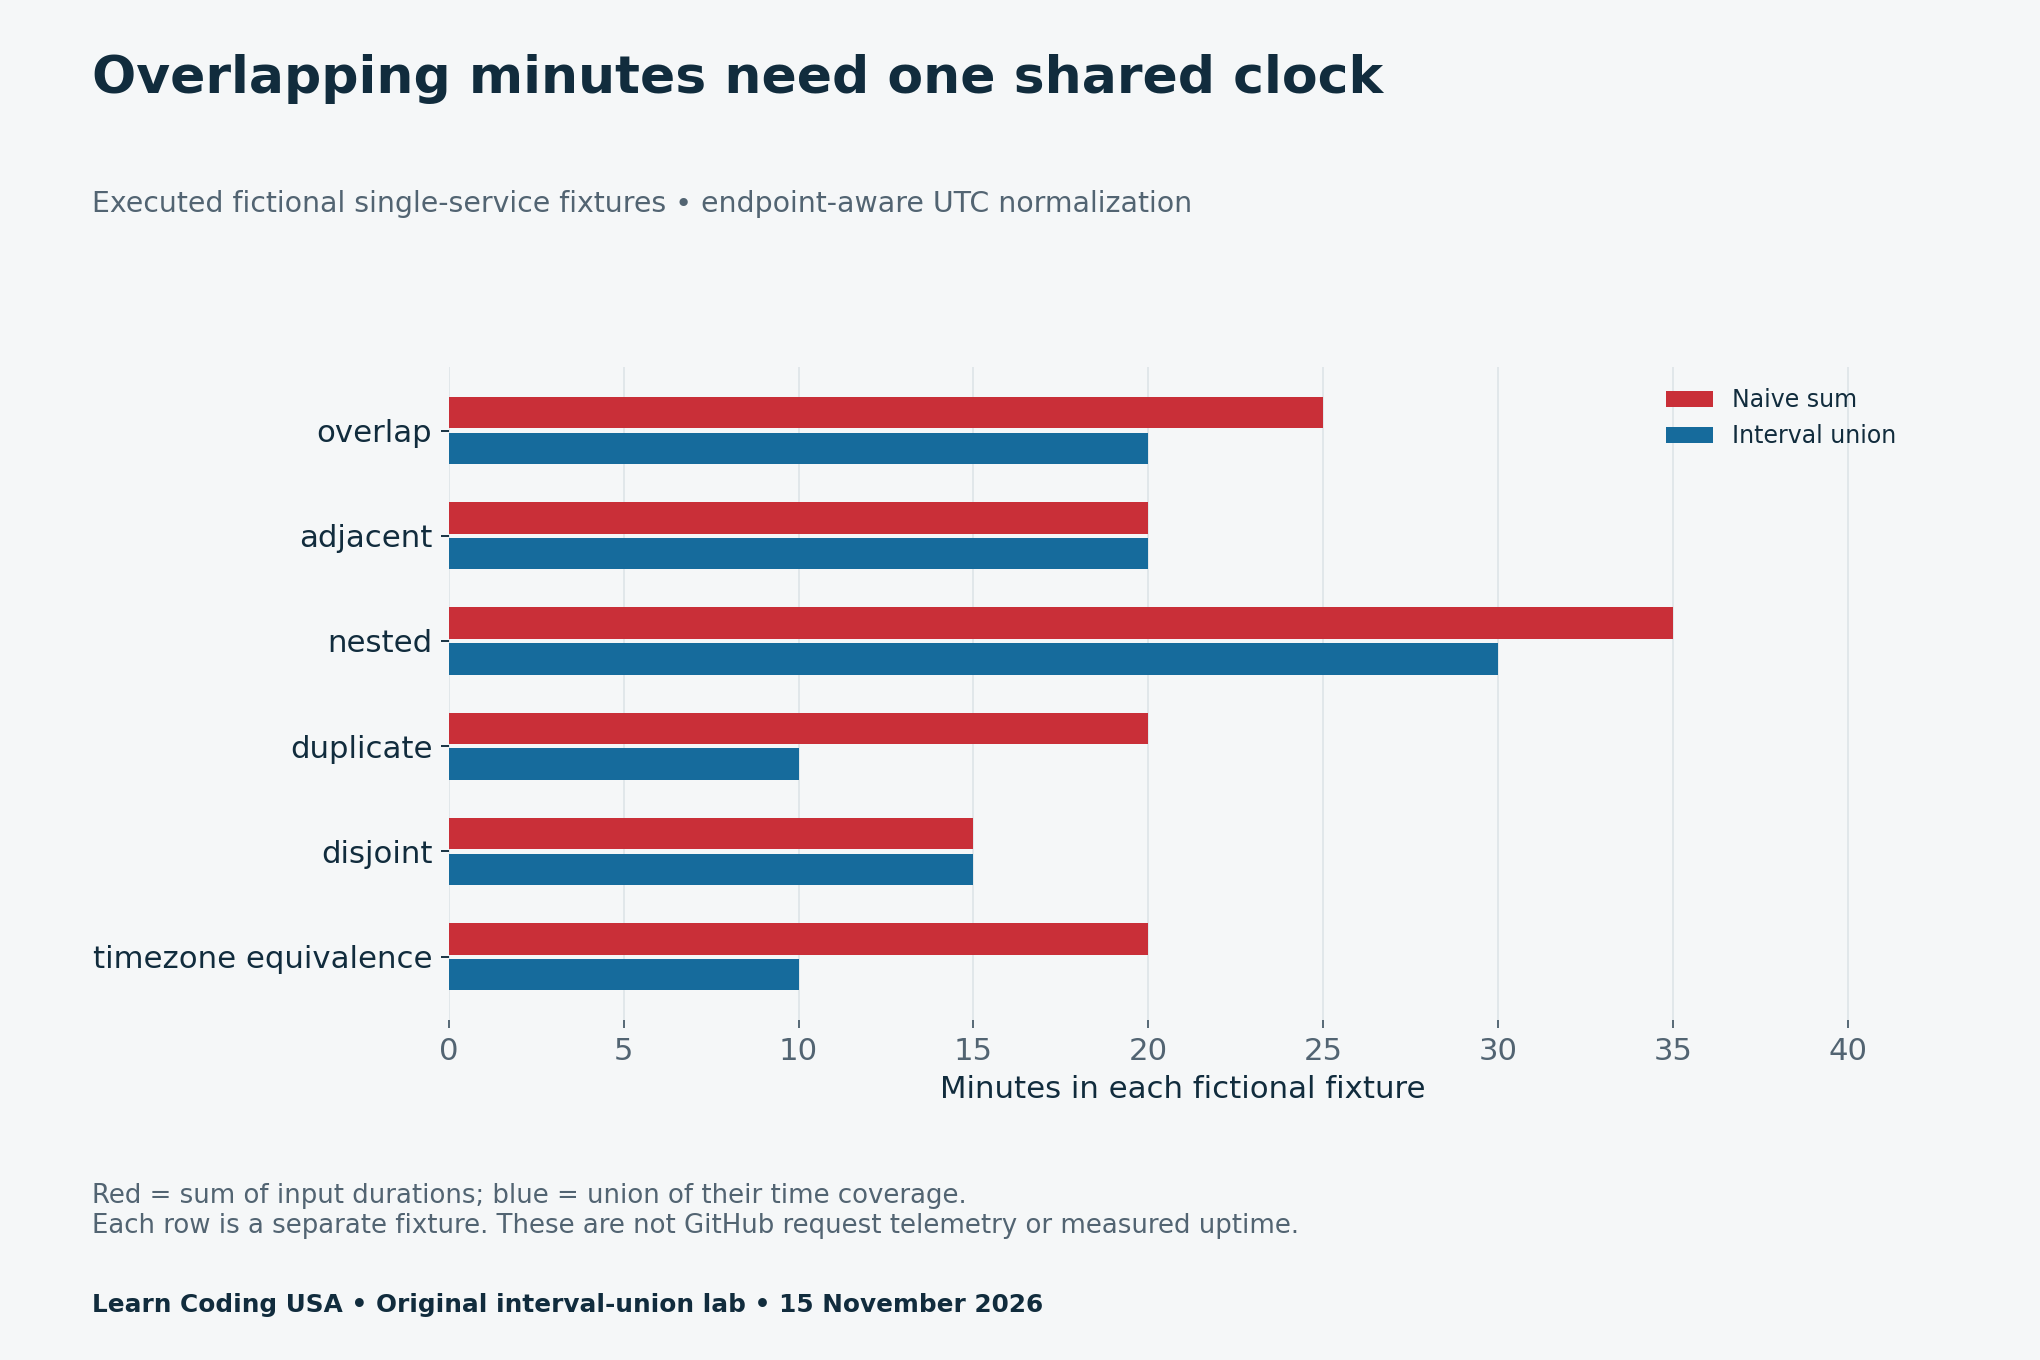
Consider two fictional disruptions from 10:00 to 10:10 and 10:05 to 10:20 UTC. Adding their lengths gives 25 minutes, but the union covers 20 minutes. The shared five-minute interval belongs on the clock once. This example is invented for testing; it is not a reconstruction of the GitHub incident.
if merged and start <= merged[-1][1]:
    merged[-1] = (merged[-1][0], max(end, merged[-1][1]))
else:
    merged.append((start, end))
This branch extends the current merged interval when coverage overlaps or touches. Otherwise, it begins a new interval. The full runner includes validation and arithmetic, so the short extract is an explanation rather than the complete implementation.
What the 11 fixtures established
Seven non-empty, valid fixtures exercised overlapping, adjacent, nested, duplicate, disjoint, zero-length and timezone-equivalent ranges. Three invalid fixtures required rejection. The final fixture supplied an empty list and expected zero covered minutes. All 11 matched the expectations fixed in the runner.
Zero length contributes no covered time under our chosen half-open interval rule. An empty list means zero only when the caller knows the observation set is complete. Missing telemetry should remain unknown instead of silently becoming an empty list. That is an application-data decision beyond the arithmetic function.
Why this is still not an availability percentage
A union calculation needs matching scope. Combining a migration pause with general request failures does not make them one universal outage. A monthly time-based availability claim also needs a complete observation window and an explicit definition of unusable service. A request-based measure needs eligible request totals instead.
Google’s service-level objectives chapter explains the importance of a carefully defined indicator. Our denominator checklist turns that principle into questions about service, population, window and impact rule. It cannot supply missing telemetry or certify an SLA.
Tech Consulting Tailored to Your Coding Journey
Get expert guidance in coding with a personalized consultation. Receive unique, actionable insights delivered in 1-3 business days.
Get StartedTimezone handling matters too. Python’s datetime documentation distinguishes aware and naive values. Our parser requires an explicit offset and converts equivalent instants before merging. It does not guess a local timezone for an incomplete record.
Download the source measures and runnable project
- GitHub October 6 source measures and scope notes (CSV)
- All 11 executed interval fixtures and results (CSV)
- Availability denominator checklist (CSV)
- Blank scoped incident-impact register (CSV)
- Interval function, fixtures and instructions (ZIP)
For more evidence-focused projects, read our PostgreSQL restore-verification lab and C# union-type testing study. Both separate a successful operation from the claim a reader actually needs to verify.
Methodology and limitations
We manually checked the five source measures against the October 6 section of GitHub’s vendor-authored report. Our separate Python exercise ran on 15 November 2026. Its CSV retains naive sums, observed unions and fixed expectations. The lab covers selected boundary cases, not every possible datetime input or monitoring failure.
The report does not provide complete request-level telemetry for this project. We therefore publish no global outage total, user-downtime estimate or monthly uptime percentage. The reusable contribution is a transparent data model and a tested calculation with explicit boundaries.


